![]()
Pump Vibration & Troubleshooting Strategies, Part 2
It is common to measure vibration for initial acceptance, for ongoing trending and predictive maintenance and for troubleshooting the cause of vibrations.
Category: Blogs October 12, 2023
Nine methods of troubleshooting pump vibration issues.
It is common to measure vibration for initial acceptance, for ongoing trending and predictive maintenance and for troubleshooting the cause of vibrations. The goal of doing this is to ensure the pump is installed and operated at industry standard vibration levels when new, to prevent failures and extend the equipment life and to identify and remediate causes.
Initial Acceptance & Commissioning
When a new or overhauled pump is installed, it should be commissioned to check the pump and system are operating as designed and expected. The commissioning should include standard vibration measures for acceptance, and this sets a baseline for future trending. ANSI/HI 9.6.4 Rotodynamic Pumps for Measurement and Allowable Values provides measurement locations and procedures and values for acceptance. The standard specifies by pump type vibration, acceptance values in overall root mean square (RMS) velocity and, for lower-speed pumps operating at 600 revolutions per minute (rpm) or less, overall peak-to-peak displacement. Overall vibration includes the vibration from all frequencies within the frequency range of the analyzer settings, so it is used for acceptance but not typically for troubleshooting the cause.
ANSI/HI 9.6.4 does not provide procedures or acceptance values for measuring shaft displacement. When shaft displacement is measured, it is generally with proximity probes mounted inside a journal bearing so the controlling factor is journal bearing clearance. If the commissioning vibration value is above industry standards, then further troubleshooting methodology can be employed to determine the cause.
Troubleshooting Methodology
Following initial acceptance testing and determination of a baseline level, troubleshooting can involve the following:
- Gathering of background information
- Review of periodic, route-based vibration data collected at consistent operating conditions
- Time waveform analysis
- Frequency spectral analysis (FFT)
- Trending over time while measuring other pump and system parameters
- Phase analysis and operating deflection shapes (ODS)
- High-speed camera
- Experimental modal analysis (EMA)
- Computer modeling (finite element analysis [FEA])
This list of troubleshooting items follows a general progression of complexity and level. Within this article, items one through six are covered with some detail/examples, while items seven through nine are discussed generally in terms of how they can be used in escalatory analysis.
1. Gathering of Background Information
- What does the general datasheet of the pump and driver and design operating conditions for flow rate, head, power and speed of rotation say?
- How many impeller vanes are there, and is anything else unique in the drive train such as gear information?
- What is the general installation condition? Are there visual cracks or degradation in the foundation, baseplate, grout, etc.?
- Is the pump new or recently repaired?
- Was the vibration issue identified upon installation or has it gradually or suddenly increased?
- What type of vibration and units are being reported?
- What is the dominant frequency contributing to the vibration?
- Are there measurements at multiple locations and directions, and if so, how do they vary?
- Is the pump flow, head, power and speed available for the reported vibration values?
- Does the vibration vary as a function of some system variable (e.g., flow, speed, level, etc.)?
- Are there identical pumps with the same vibration characteristics?
- Are there failures that are thought to be contributing to this vibration (e.g., repetitive seal or bearing failures, high bearing temperatures, cavitation damage, coupling damage, etc.)?
The first three bullet points, which gather information about the pump design, operation and general installation condition, need to be gathered prior to engaging in additional primary vibration data gathering in the troubleshooting process. All the remaining information may not be available up front, but if it is, it can point the analyst in the right direction and make additional data gathering more efficient.
2. Review of Periodic, Route-Based Vibration Data Collected at Consistent Operating Conditions
Many maintenance programs will employ periodic monitoring that should be conducted at the same location(s) and operating conditions for trending purposes. Generally, each data set includes an overall value, time wave form and FFT. Review of this data helps identify how the vibration has progressed and provides an alarm to the analyst to look in more detail at specific areas.
3. Time Waveform Analysis
Time waveform data is typically reviewed in peak (pk) acceleration. This data can be collected from the periodic route data in item two or from additional data gathering for the purpose of troubleshooting. This is the raw data, and it can confirm or provide insight into faults such as impacting, hydraulic issues, cavitation, gear and bearing faults, amplitude modulation, rubbing, non-linear (more movement in one direction) and-high frequency vibration faults.
However, the time wave form often includes many synchronous and non-synchronous frequencies, so it can look messy and requires a trained eye to interpret the data. Image 1 is an example of a five second time wave form that was gathered to help visualize if impacting events were occurring and if they occurred at a specific period.
4. Frequency Spectral Analysis (FFT)
The FFT is a useful tool in visualizing the frequency content from the time wave form. The vibration analyzer performs this function and outputs the vibration data as a function of frequency or orders of shaft rotational speed. An amplitude peak is presented at each frequency, identifying the primary frequency component(s) of the vibration. This is typically the easiest presentation to understand typical forcing functions within the pump and drive training. For example, vibration at 1x may point to imbalance as the source of the force, or a vibration frequency that aligns with impeller vane pass frequency may point to the impeller passing the volute tip as a source of the force.
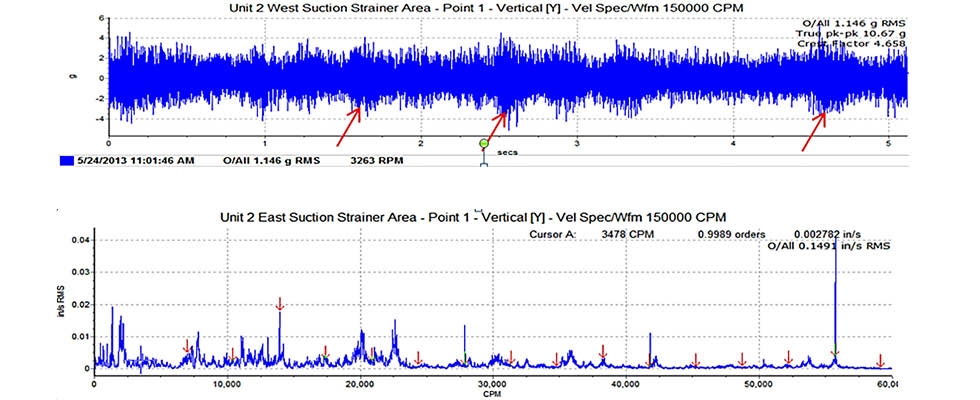
Image 1 (top): Time wave form data showing random impacting events due to adverse recirculation and cavitation impacting
Image 2 (bottom): FFT showing orders of shaft rotating speed with red arrows
Caution, experience and confirmation techniques need to be used to determine if the high vibration at these frequencies is caused by the suspected force because some faults, such as misalignment and imbalance, can have similar vibration frequency. The same experience and confirmation techniques are needed to understand if the force is too high or if the high vibration is caused by other structural dynamic issues, such as structural looseness or resonance. Image 2 illustrates the FFT for the time wave form in Image 1. This image illustrates many frequencies are contributing to the overall vibration of 0.149 inches per second RMS, and some of the vibration lines up with order of shaft speed (red arrows), but there is also a great deal of nonsynchronous vibration in the FFT, which is consistent with impacting noted in the time wave form.
5. Trending Over Time While Measuring Other Parameters
The cause of the high vibration can be related to system operation, such as speed of rotation, flow rate, submergence, net positive suction head available and inadequate intake/piping design that is exacerbated at certain conditions. This can result in the high vibration only occurring or getting worse during certain system conditions. To screen for this, continually logging all relevant data for a sufficient period is required. The screening period depends on the system and how it varies naturally or how easily it can be manually adjusted to cover the desired variation. This also requires the ability to log data simultaneously or with accurate time stamps so it can be matched up during the analysis. Typical system operation related faults that can be detected are as follows: operating at too low a flow rate and resonance.
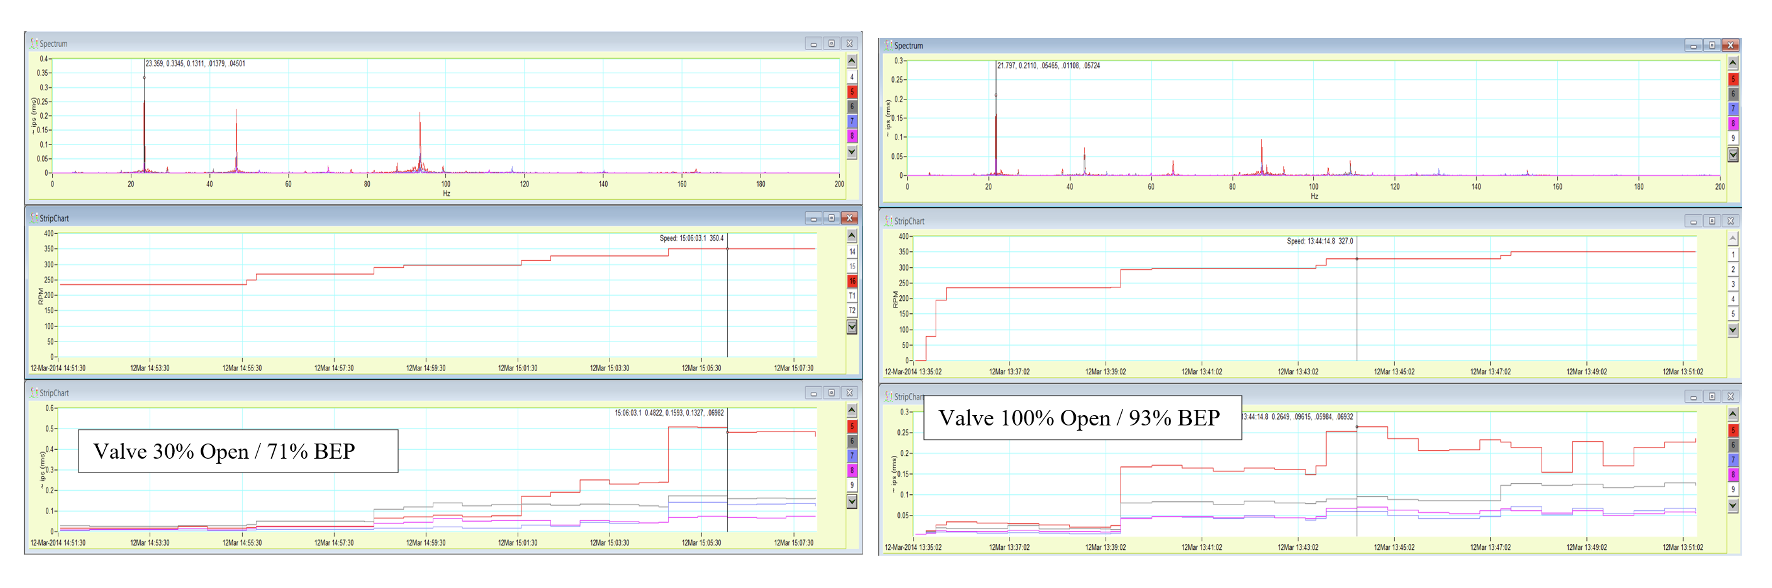
Image 3 provides two trends for the same pump, showing vibration logged at multiple locations as a function of speed. The left figure is a lower flow rate (71% of the best efficiency point [BEP] flow rate), and the right figure is for a higher flow rate (93% of BEP). What can be noted is the vane pass vibration (3x) is the main contributor to the overall vibration; near the maximum speed of 330 to 350 rpm, the overall vibration is highest, and the vibration is nearly double at the lower flow rate. This does not provide the analyst with a clear picture of the cause, but it does provide important information that can be further evaluated. For example, there could be a resonance occurring at the vane pass frequency, and it is evident the vane pass force is greater at the lower flow condition.
6. Phase Analysis & Operating Deflection Shape (ODS)
Once frequency is known and multiple measurements are taken, phase analysis is the next step in determining the operating deflection shape. Phase is the angular difference between the displacement of measurement points.
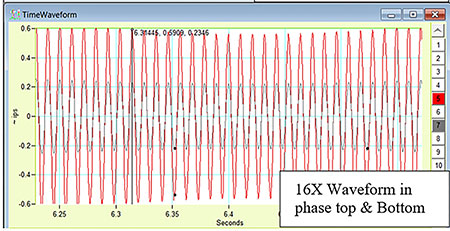
Therefore, phase analysis requires a tachometer reference or multichannel analyzer with a stationary accelerometer reference so all other vibration measurements can be compared to the reference. To illustrate phase, Image 4 shows a 16x time waveform for the top (red) and bottom (gray) on a vertical bearing housing measured in the same plane. The black dot on the wave denotes the tachometer reading (1x). It is visually noted the vibration amplitude is in phase from the top to the bottom of the bearing housing.
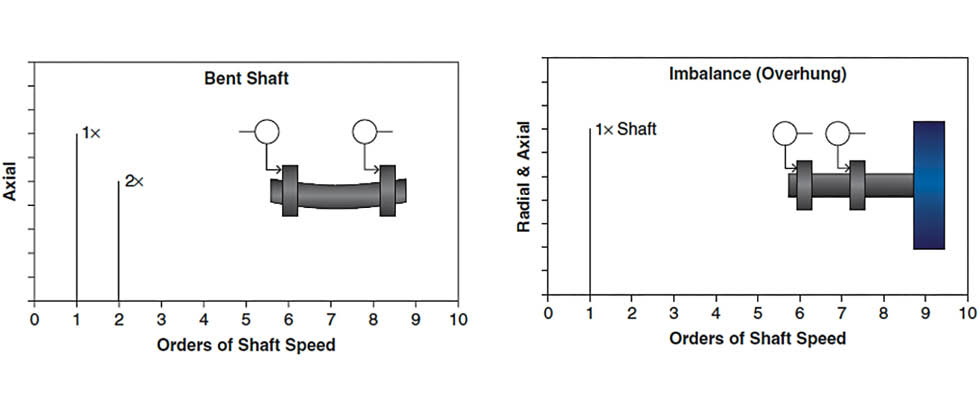
Forced vibration from different mechanisms can have the same frequency but cause a different ODS. As illustrated in Image 5, phase analysis can be as simple as comparing the phase difference between two measurements. For example, users might check the phase across the coupling or bearing frame to determine if the source of vibration is imbalance, bent shaft or alignment related. Image 5 shows that bent shaft and overhung imbalance will likely have elevated 1x amplitude measured in the axial direction, but the phase signature differs and can be used to help differentiate the cause.
A full ODS analysis, which uses cross phase to animate the entire structure to visualize complete vibratory motion, can require hundreds of data points across the machine, structure and system. Due to the number of measurements, post processing and required software for animation, ODS analysis can be time consuming and costly; therefore, it is conducted in difficult cases to help confirm conditions like structural looseness or to confirm the ODS matches the mode shape of a natural frequency. Understanding the ODS supports corrective action recommendations on how to modify the equipment or structure.
7. High-Speed Camera
Camera technology and software has progressed so that a video of the vibrating equipment can be taken and software can output motion amplified video that depicts the deflection shape of the structure. This can be used as a quicker method to diagnose the motion of the equipment—like an ODS but without taking hundreds of measurements. It can be particularly useful to visualize the vibration on items that users cannot easily attach an accelerometer to (i.e., high temperature, elevated piping, insulated parts). There are limitations and considerations to the use of this technology, such as the field of view, frequency limitations, lighting and lack of 3D view; therefore, it does not replace ODS analysis.
8. Experimental Modal Analysis (EMA)
EMA is conducted to determine the structural natural frequencies and mode shapes. It requires impacting the structure with a calibrated force hammer at a location that will excite the natural frequencies, while using a roving accelerometer to collect response data at locations along the structure. The resulting data identifies natural frequencies, and the frequency response function data can be used to animate the mode shapes. This type of analysis would be done when the preceding data indicated resonance as a possible cause. The ODS analysis in item six or the motion amplified video in item seven could be compared to the EMA natural frequencies and mode shapes.
9. Computer Modeling
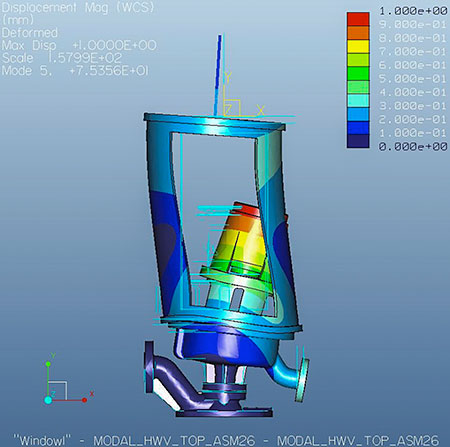
In most cases of resonance, computer modeling is required so alternative designs can be considered to fix the issue. This requires FEA code and creating an accurate model of the structure or rotor. For rotor dynamics, specific or custom rotor dynamic code may be used. The model will predict the natural frequencies and their mode shapes. When possible, it is beneficial to calibrate the model to match the EMA prior to using the models to evaluate design modifications. Image 6 illustrates a higher order natural frequency calculated with FEA, which calculates a natural frequency at 75.3 hertz (Hz) with an out of phase mode shape between the bearing housing and motor stand. This model is for an updated motor stand design. Validating that the updated design moved this mode above the pump operating speed of 60 Hz.
Troubleshooting pump vibration is a process that requires the analyst to act like a detective to gather existing information, understand the pump forces and dynamics and determine what additional data to gather. The analysis can be straightforward or require escalating analysis and modeling to find the root cause. This was not a complete list of the measurements or data that could be gathered in a troubleshooting effort but covers the fundamentals and primary vibration data. The corrective action for the vibration could take many different forms but will involve altering the force or the dynamics.
Read Part 1 – Pump Vibration & Troubleshooting Strategies
___________________________________________________________
Originally published in Pump & Systems, October 10, 2023.
SUBSCRIBE TODAY
Get the latest pump industry news, insights, and analysis delivered to your inbox.